I am a medical data analyst at Roche. Previously I was a graduate student in the Department of Statistics and Actuarial Science at University of Waterloo and my advisor was Wayne Oldford. I can be contacted by email.
Education
- (2016) PhD in Statistics, University of Waterloo.
- (2009) MMath in Statistics, University of Waterloo.
- (2005) Dipl. Ing. FH in Data Analysis and Process Design, Zurich University of Applied Science.
Research
My research interests include interactive data visualization, pattern recognition, multivariate statistics, and statistical learning.
- loon: loon is an interactive statistical visualization toolkit that has bindings with R and Tcl. You are welcome to test the beta versions of `loon` that are available on the github project site. I am currently working on making `loon` available on CRAN.
- RnavGraph: RnavGraph is an open source tool that I have developed in R, Tcl/Tk, and C and is available as an R package on CRAN. RnavGraph is a tool to visually cluster and explore high dimensional data that implements an idea first proposed by Hurley and Oldford (2011). Their idea involves the use of graphs as a navigational infrastructure for a controlled exploration of high dimensional data. www.navgraph.com
Upcoming Talks
- BaselR on April 13, 2016, 6:30pm at the Roche Learing Center Auditorium, 5th Floor. Title: "Interactive Data Visualization using the Loon package"
Talks
- Waddell, Adrian; Oldford, R. Wayne: "Interactive Data Visualization using the Loon package". useR! 2015, Aalborg, Denmark.
- Waddell, Adrian; Oldford, R. Wayne: "Extending RnavGraph to use the R Plotting Facility". SSC 2012 in Guelph, Canada. video of slides
- Waddell, Adrian; Oldford, R. Wayne: "RnavGraph, A visualization tool for navigating through high-dimensional data". ISI Dublin, 2011, invited presentation.
- Waddell, Adrian; Oldford, R. Wayne: "RnavGraph and the tk canvas widget". useR 2011 in Warwick.
- Waddell, Adrian: "R packages and Sweave". Graduate Student Seminar 2011 at the University of Waterloo.
- slides, movie1, movie2, movie3, package
- Remember, you need to install the R tools if you are using Windows
- Waddell, Adrian; Oldford R. Wayne: "RnavGraph, Interactive visual clustering". SSC 2011 in Wolfville, Canada.
Posters
- Waddell, Adrian; Huang, Qianyi; Oldford, R. Wayne: "Exploring Spatial and Temporal Heterogenity of Environmental Noise in Toronto" SSC 2013 in Edmonton, Canada. pdf
- Waddell, Adrian; Oldford, R. Wayne: "Visual Clustering of High-Dimensional Data" InfoVis 2012 in Seattle, USA. pdf
Publications, Non-Refereed
- Waddell, Adrian; Oldford, R. Wayne: RnavGraph: A visualization tool for navigating through high-dimensional data. ISI 2011, invited paper. pdf
- Oldford, R. Wayne; Waddell, Adrian: Visual Clustering of High-dimensional Data by Navigating Low-dimensional Spaces. ISI 2011, invited paper. pdf
- Waddell, Adrian; Hosang, Jurg: Optimum Policies for Dynamic Supply Chain Management; Competitive vs. Cooperative View. In: Proceedings of the IPLnet 2005 Workshop / IPLnet (Hrsg.) - Schloss Bottstein, 2005, S. 9 ff. pdf
Projects
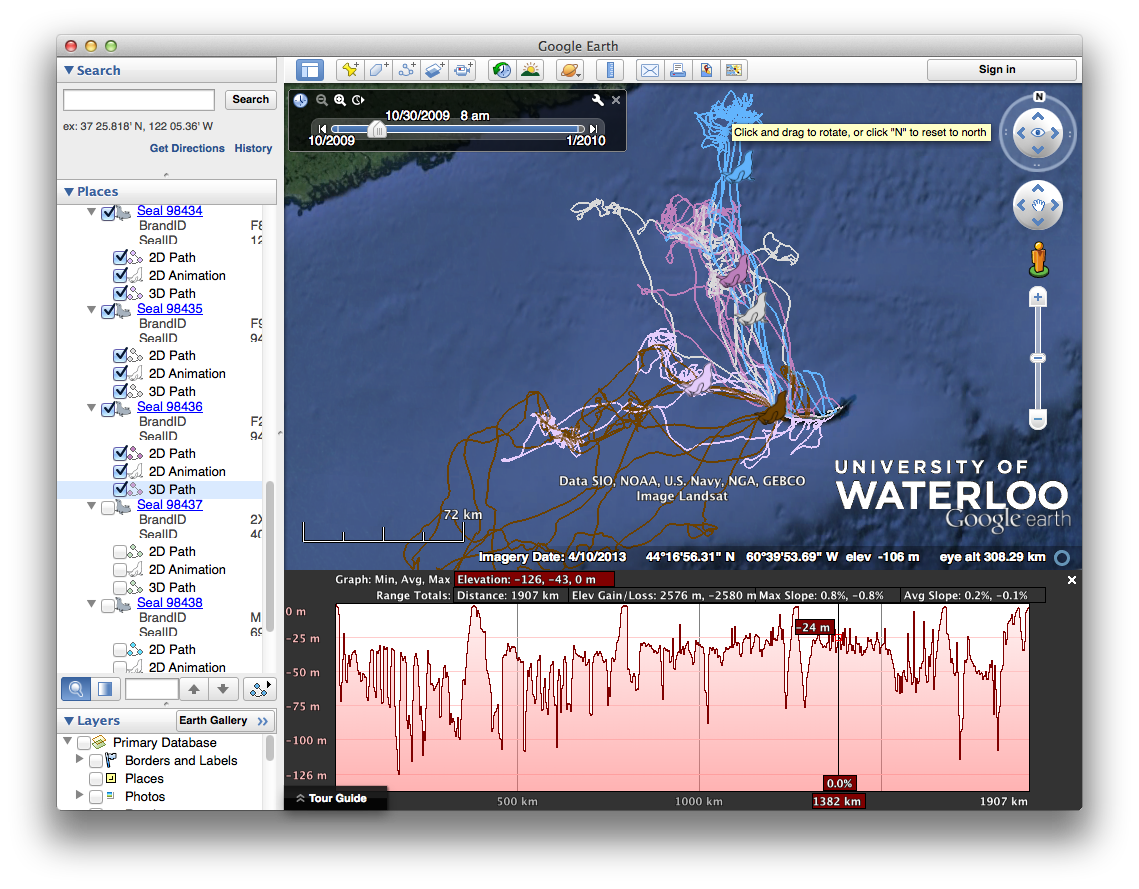
- Spatio-Temporal Visualization of Seal Migration Data in Nova Scotia: This project was part of "The Ocean Tracking Network Canada" research program and involved outfitting grey seals from Sable Island at the coast of Nova Scotia, Canada, with a GPS receiver and altimeter to collect location and elevation information. One of the objectives of this study was to investigate the migration and fishing behaviour of the grey seals. As part of this project, I aggregated the data by hour for each seal and then visuallized the seal trajectories over a 6-month period in Google Earth using the Keyhole Markup Language. screenshot
- Zurich Housing Data: This project was part of the course work in spatial statistics during my master's program at the University of Waterloo. The goal was to get an overview of the rental market in Zurich and to automatically determine whether a particular rental apartment was priced well in comparison to apartments that had similar characteristics. slide deck 1, slide deck 2, slide deck 3
Statistical Computing
- R Introduction for Economic Studens is a six lecture course I designed and taught to PhD. studends from the department of economics at the University of Waterloo. The material is, however, useful for anyone who wants to learn R. website
- Essential Software for Statisticians: The Department of Statistics and Actuarial Science at the University of Waterloo paid me in form of a one term Research Assistance position to write about software that is useful to statisticians. The slide decks are: Emacs and Eclipse, R introduction, Functions and Methods in R, Tcl introduction for R users (R-Source), Tk geometry manager for R users (R-Source)
Personal
- Pet Patrol website: Pet Patrol is a local cat-rescue organization in Waterloo. I got involved with Pet Patrol when I adopted a cat in September 2011. I set up a content management system (WordPress) with custom plugin and theme in order to automate the cat adoption workflow. www.petpatrol.ca